Wk6: The Representation Gap – Kickoff
November 8, 2026 Leave a Comment
November 8, 2026
An idea that stuck with me
My son’s friend Taurean and I talked about this idea while he was deciding what to do for his MIS capstone at Western. He ended up doing a different project, but a question from that conversation stuck with me. How closely do the people we elect resemble the people they represent?
I figured that would be easy enough to look up. I found election results, Census data, and plenty of people willing to tell me what it all meant. I had a much harder time finding a place where I could put the numbers side by side and see for myself.
So that’s what thwe are building for Week 6 of One Project Every Week. It’s called The Representation Gap.
Same voters, different winners
I think our legislatures could do a better job of reflecting the people they represent. I also think partisan gerrymandering ought to be illegal, including when it helps the people I voted for. If the data proves me wrong about how big a gap is or where it shows up, good. I’d rather actually know, than assume.
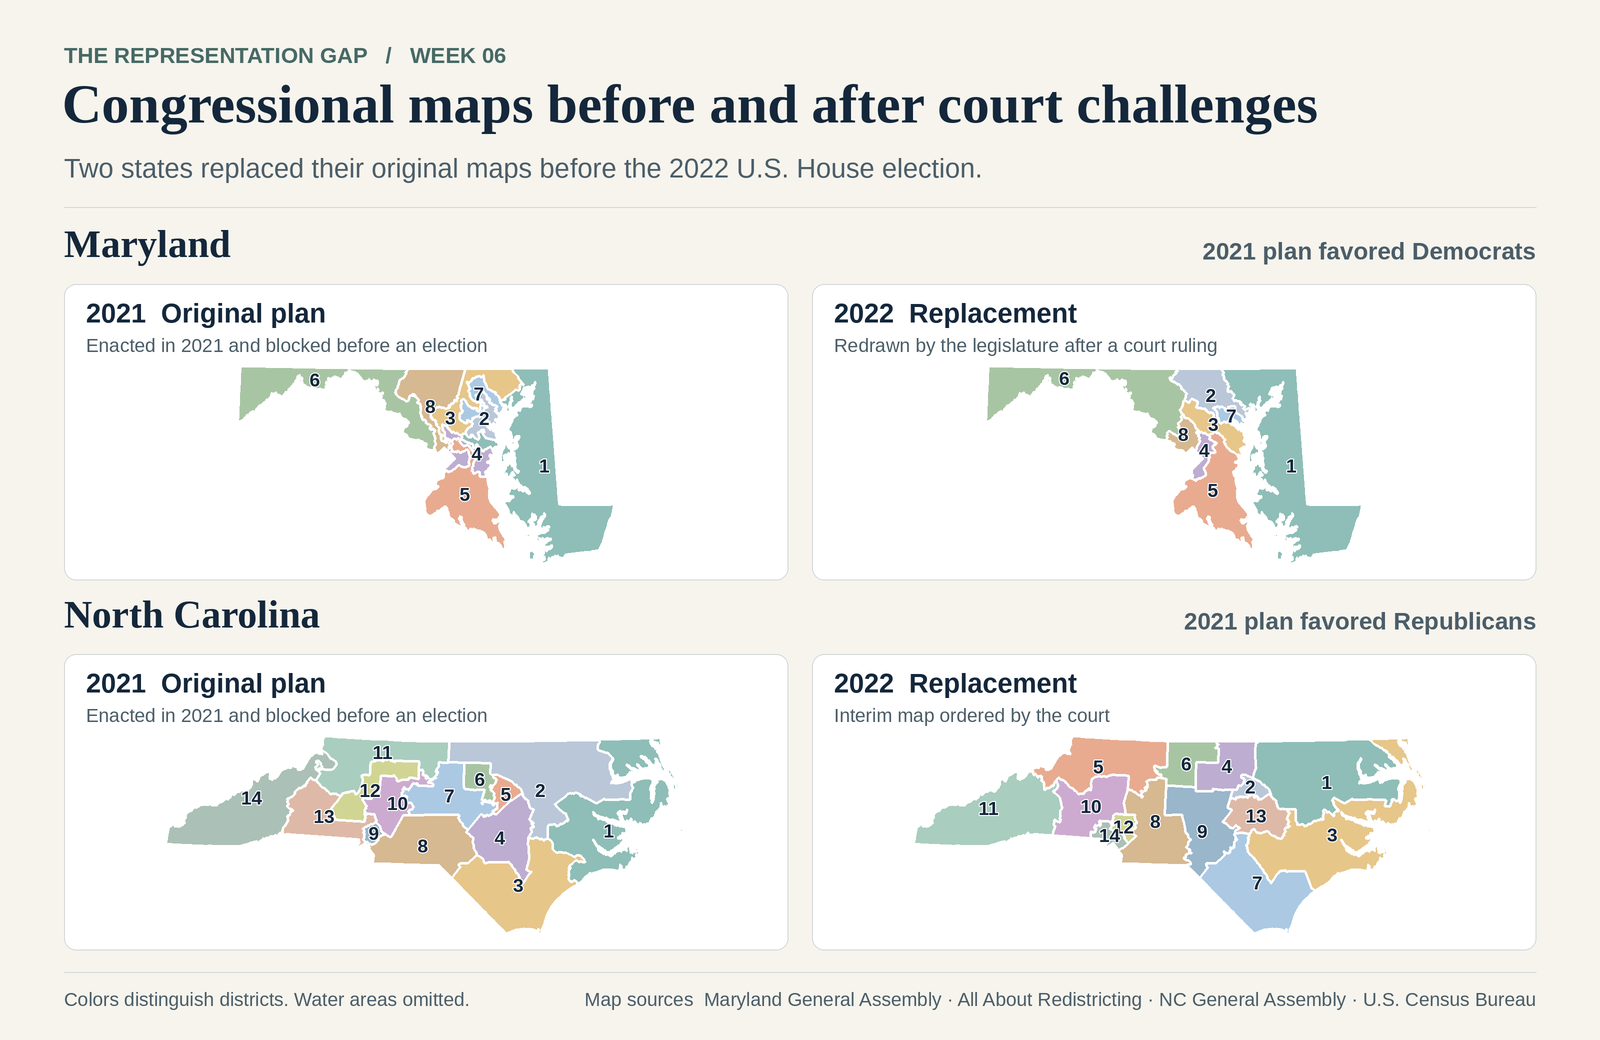
I want to start with a fake map and a slider. Move the slider and the district lines change. Everyone stays put. Nobody changes their vote. Watch what happens to who wins.
What I want to be able to look up
I want to pull up Michigan and see who represents me in Lansing and in Washington. Then I want to see who held those seats in earlier years, how the makeup of those chambers changed, and how the population changed over the same stretch. You should also be able to punch in an address, find your representatives, and get their public contact information.
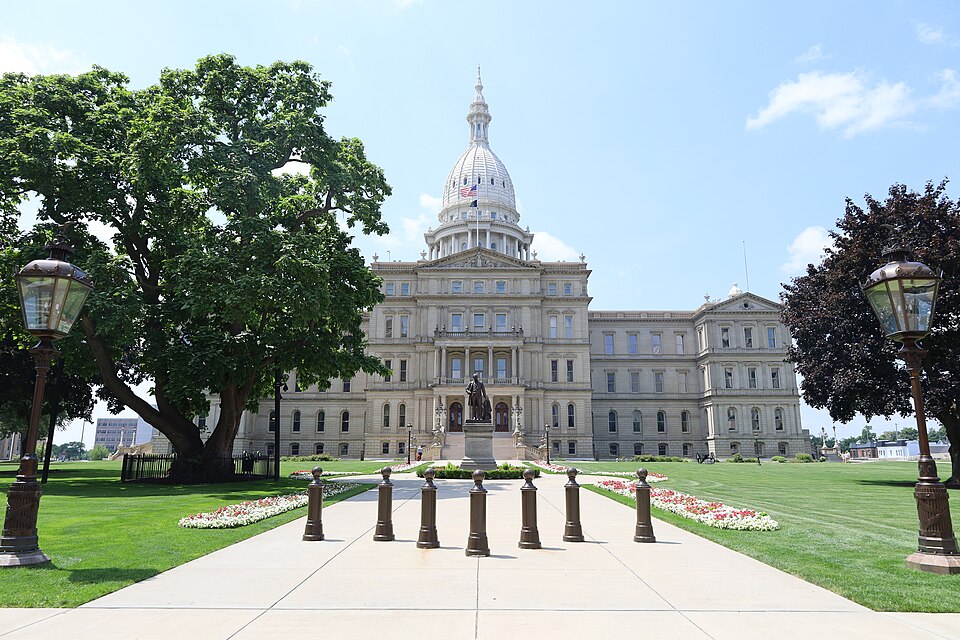
Photo credit: Antony-22, CC BY-SA 4.0, via Wikimedia Commons
The goal is all 50 states, both chambers of Congress, and every state legislative chamber. If thwe can’t verify something about a legislator, the site should say so. A blank with an explanation beats a guess.
By the end of the week, I want you to be able to pull up your own state and see how well it represents you.
 About Rob
