Wk6: Representative – Launched!
November 14, 2026 Leave a Comment
After the election, I wanted to see for myself how well the people we elect reflect the people they represent. I had a hunch about what I’d find. I also knew I’d never really looked.
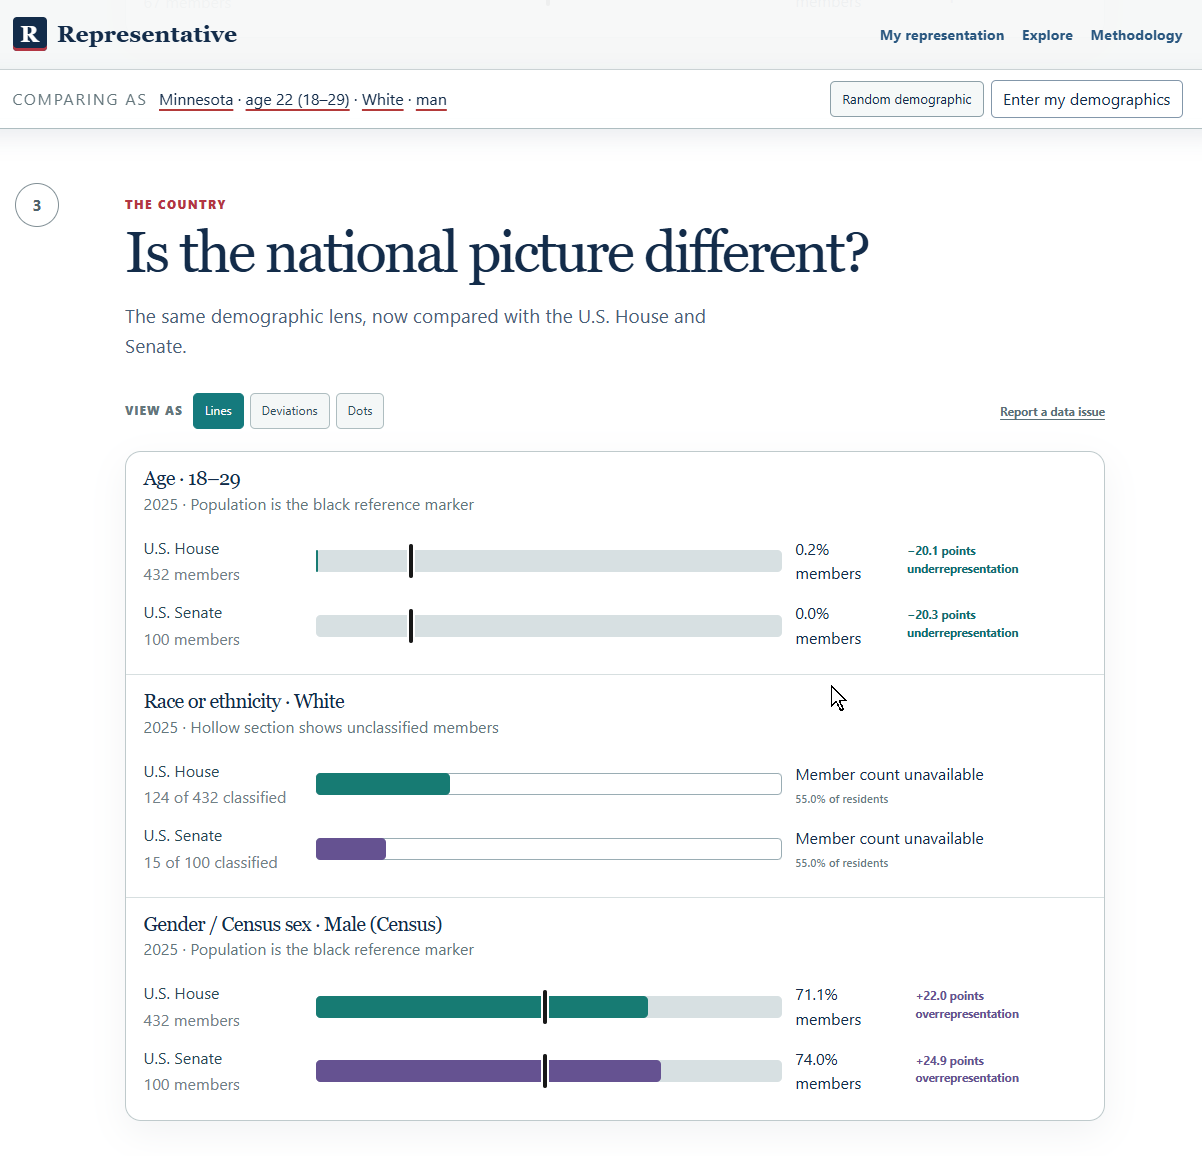
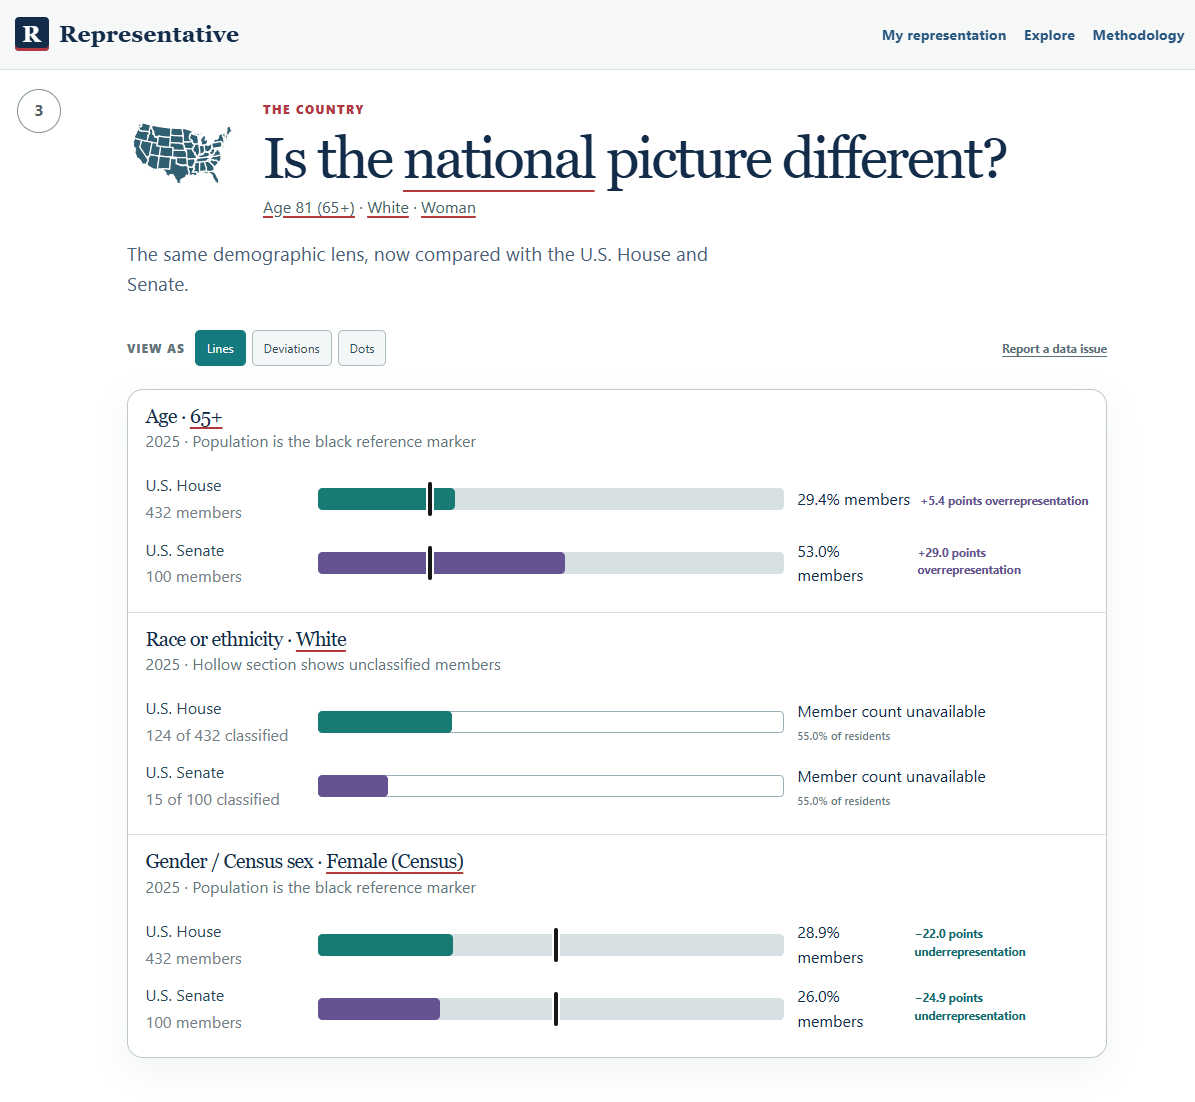
So for Week 6 of One Project Every Week, I built Representative. The first thing I’d try is Random demographic under My representation. You’re magically transformed into somebody else for a minute. Maybe you’re 23 and living in a state you’ve never been to. Now look at how many people your age hold office. Some of those numbers are pretty shocking. You look at the faces of the “representatives” that are supposed to represent you, but are nothing at all like you.
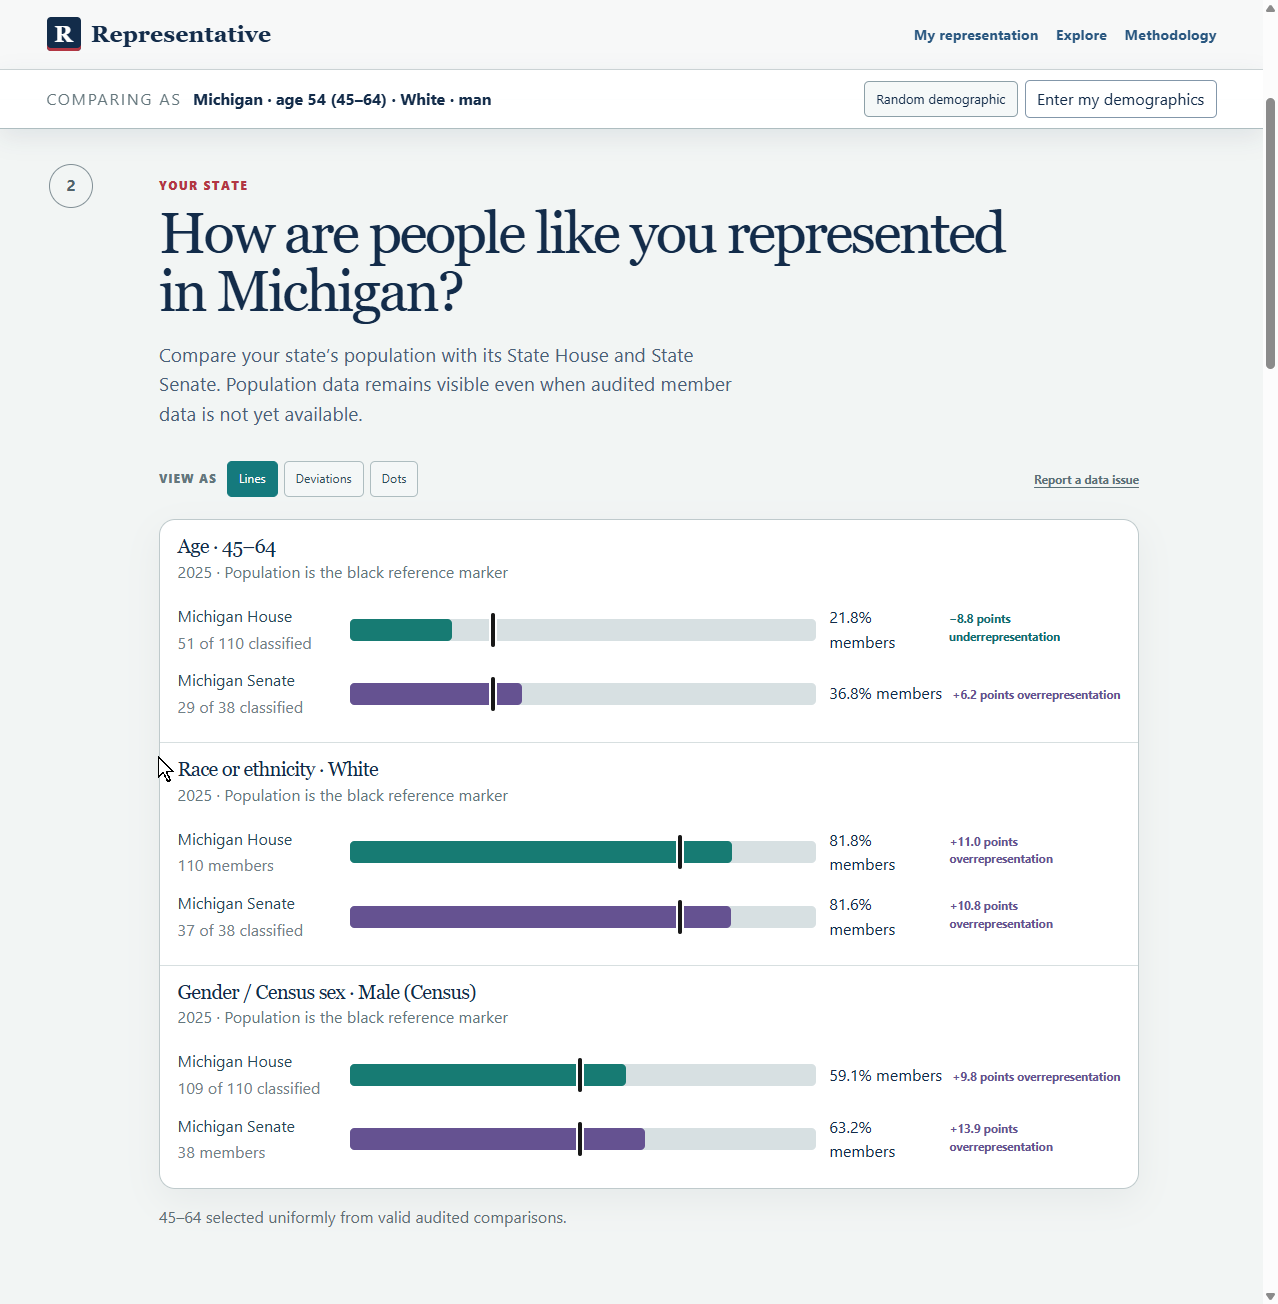
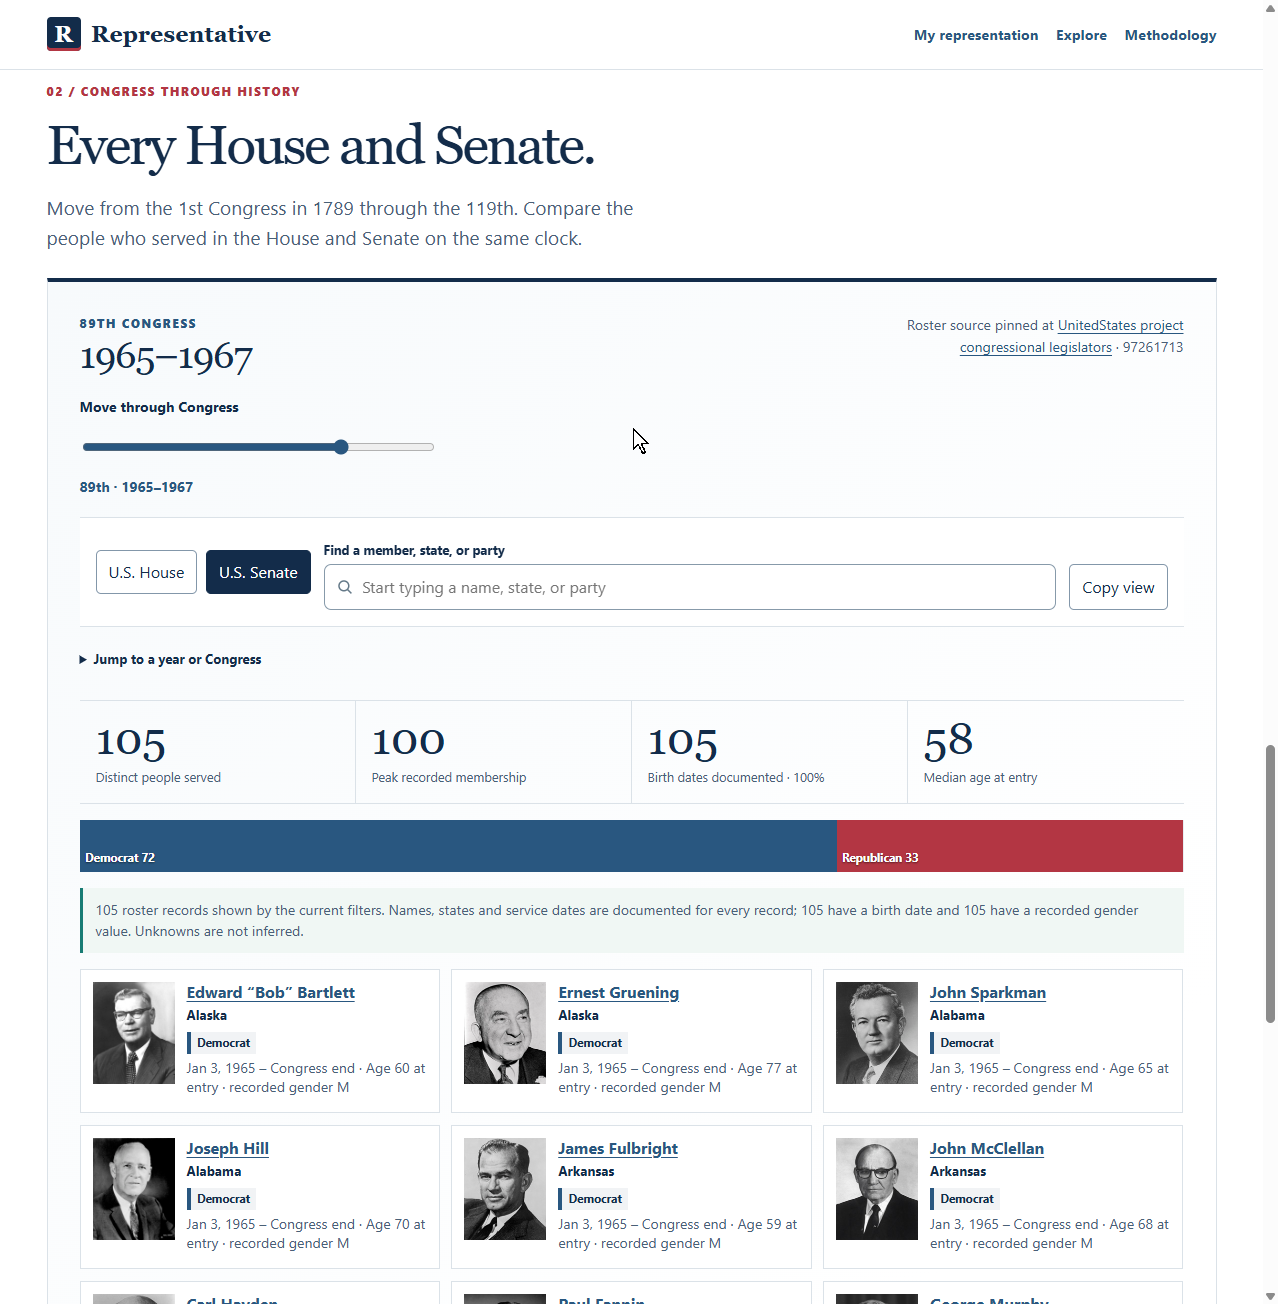
Getting that flow right took most of the week. I’d built an explorer full of maps and historical data that I could happily spend an afternoon in. The question I wanted people to get to first was simpler. Who actually represents me? Once I made that the guided journey, Explore could be its own sandbox. It’s still fun to poke around in there.
One seat out of 432
About one in five U.S. adults was 18 to 29 in the 2025 data. In the July snapshot, one of 432 U.S. House members was in that age group. People 65 and older made up about one in four adults and held 53 of 100 Senate seats. The age limits are part of the story. You have to be 25 to serve in the House and 30 to serve in the Senate. I still kept coming back to that one House seat. Census age data · Congressional age requirements
Move the lines
In Alabama’s Black Belt, more than three-quarters of Macon County residents identify as Black alone. The county was part of the court-redrawn district that elected Shomari Figures in 2024. When he joined Terri Sewell, Alabama had two Black U.S. House members serving together for the first time. The map changed again for 2026, and Figures won reelection. Census · 2024 election coverage · 2026 election coverage
There’s a fictional map on the site where you can try this yourself. Move the slider and watch the seat totals change while every voter stays put.
What I’d add next
The hollow parts of the charts show where we’re missing data. I’d like to make that a little wiki. If you find a source that fills a gap, you could submit it for a moderator to check before it goes into the chart.
I’d also show members-elect alongside sitting members between the election and the start of the new Congress. I want to see who’s coming in and know who picks up the phone today.
Try Representative. Play with Random demographic, then look up your own district. Call or write your representative and ask what they’re doing about fair maps. If you feel unheard, tell them that, too.
And VOTE.
And if you’re bored check out the explore page, is amazing the free data out there.
 About Rob